Usage Analytics
See what fans actually watch
Which games got the most traffic? Where did that spike on Saturday come from -- WhatsApp or Instagram? How many people saw your title sponsor's logo this season? The analytics answer the questions you actually ask, in plain numbers, without making you learn Google Analytics.
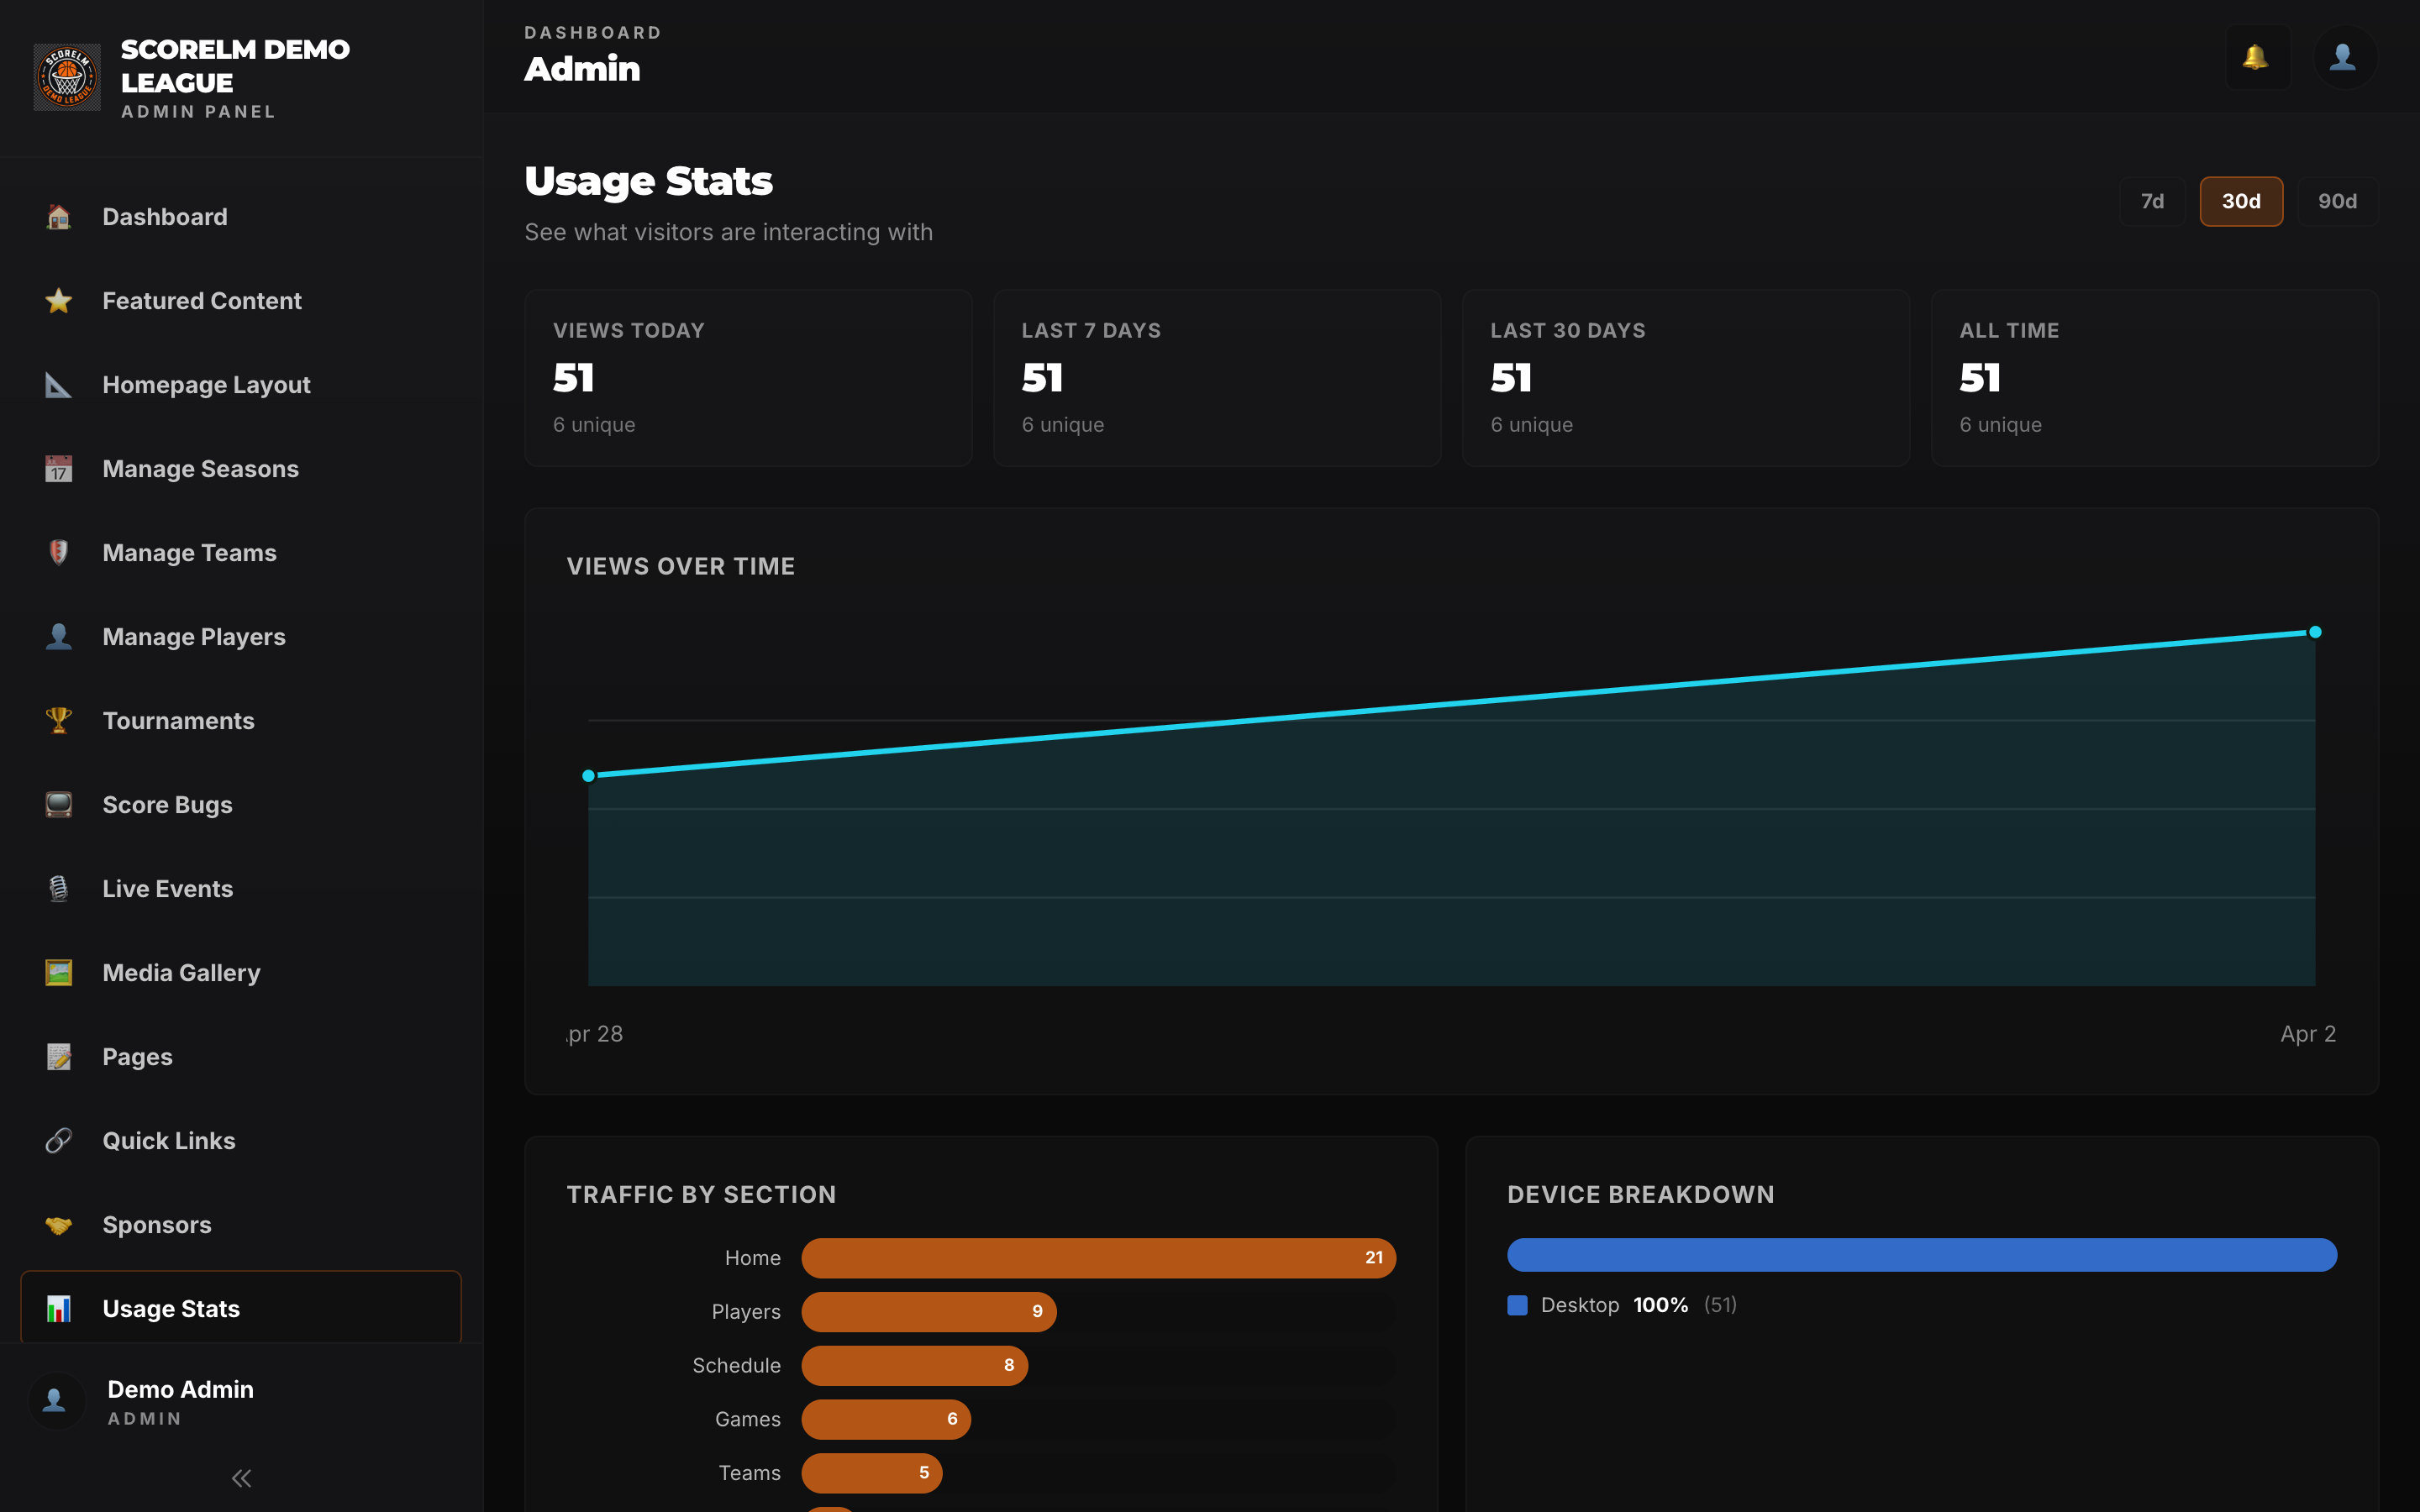
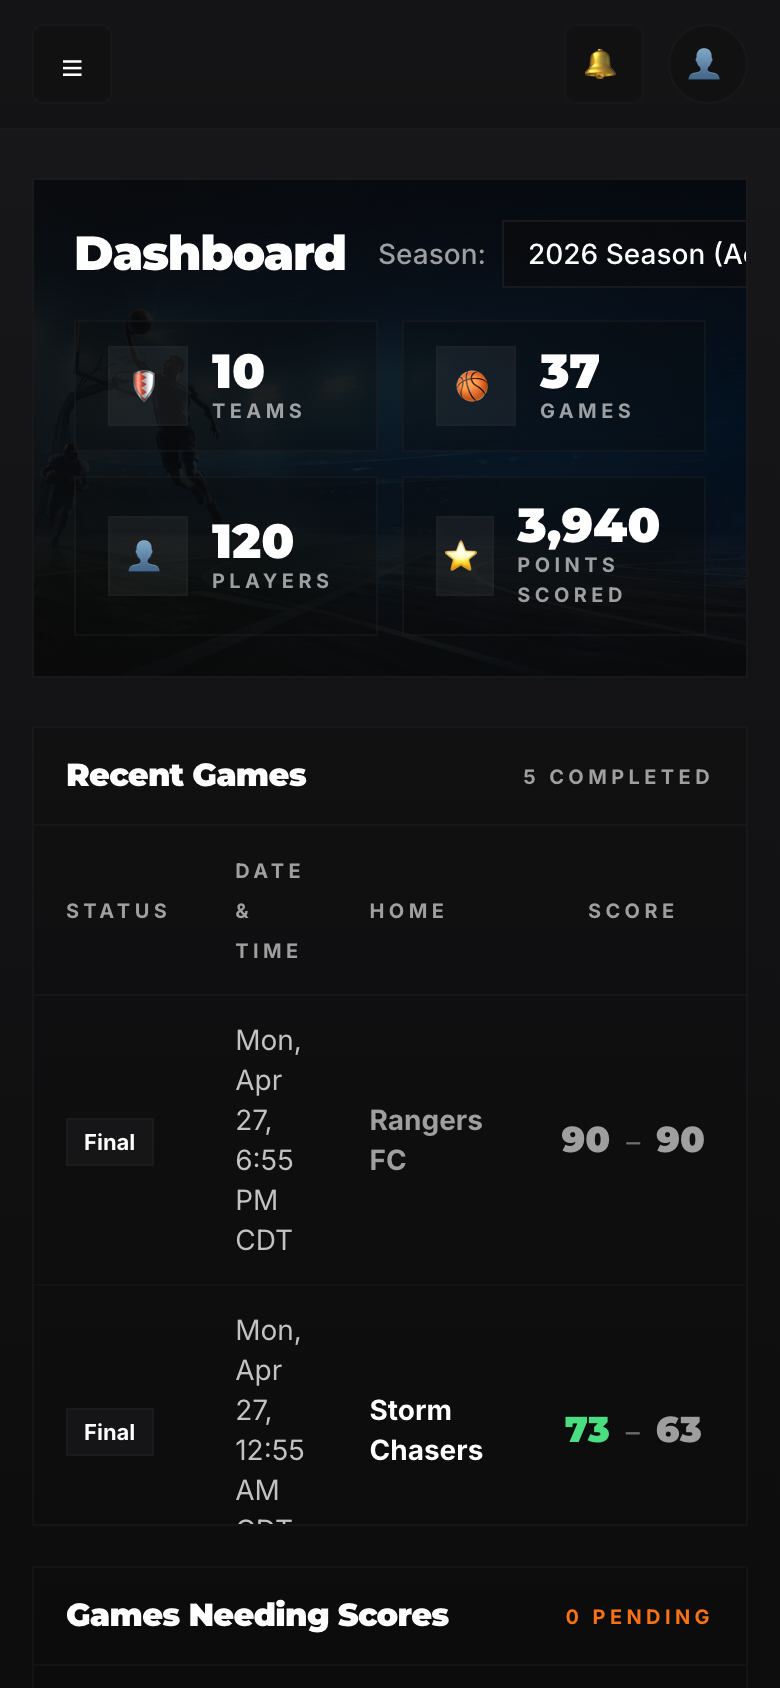
Traffic Overview
Page views and unique visitors, across the whole league
One view for the entire league site -- schedule, standings, rosters, stats, game pages. Broken down by day, week, or month. You see trends without filtering through noise.
- Total page views and unique visitors, side by side
- Toggle between daily, weekly, and monthly views
- Compare this season to last -- same week, same day
- See the game-day spikes without squinting at a chart
Top Games, Teams, Players
Who and what people actually care about
Ranked lists of the most-viewed games, teams, and players -- by traffic, stream views, and shares. You'll find out pretty quickly that the rivalry game nobody was hyping got double the views of the championship.
Top Games
Ranked by page views, stream plays, and shares. Filter by week, month, or season.
Top Teams
Which rosters pull traffic to their page, and which game pages they appear on most.
Top Players
Profile views and highlight plays. Useful when a player asks why they should care about the league site.
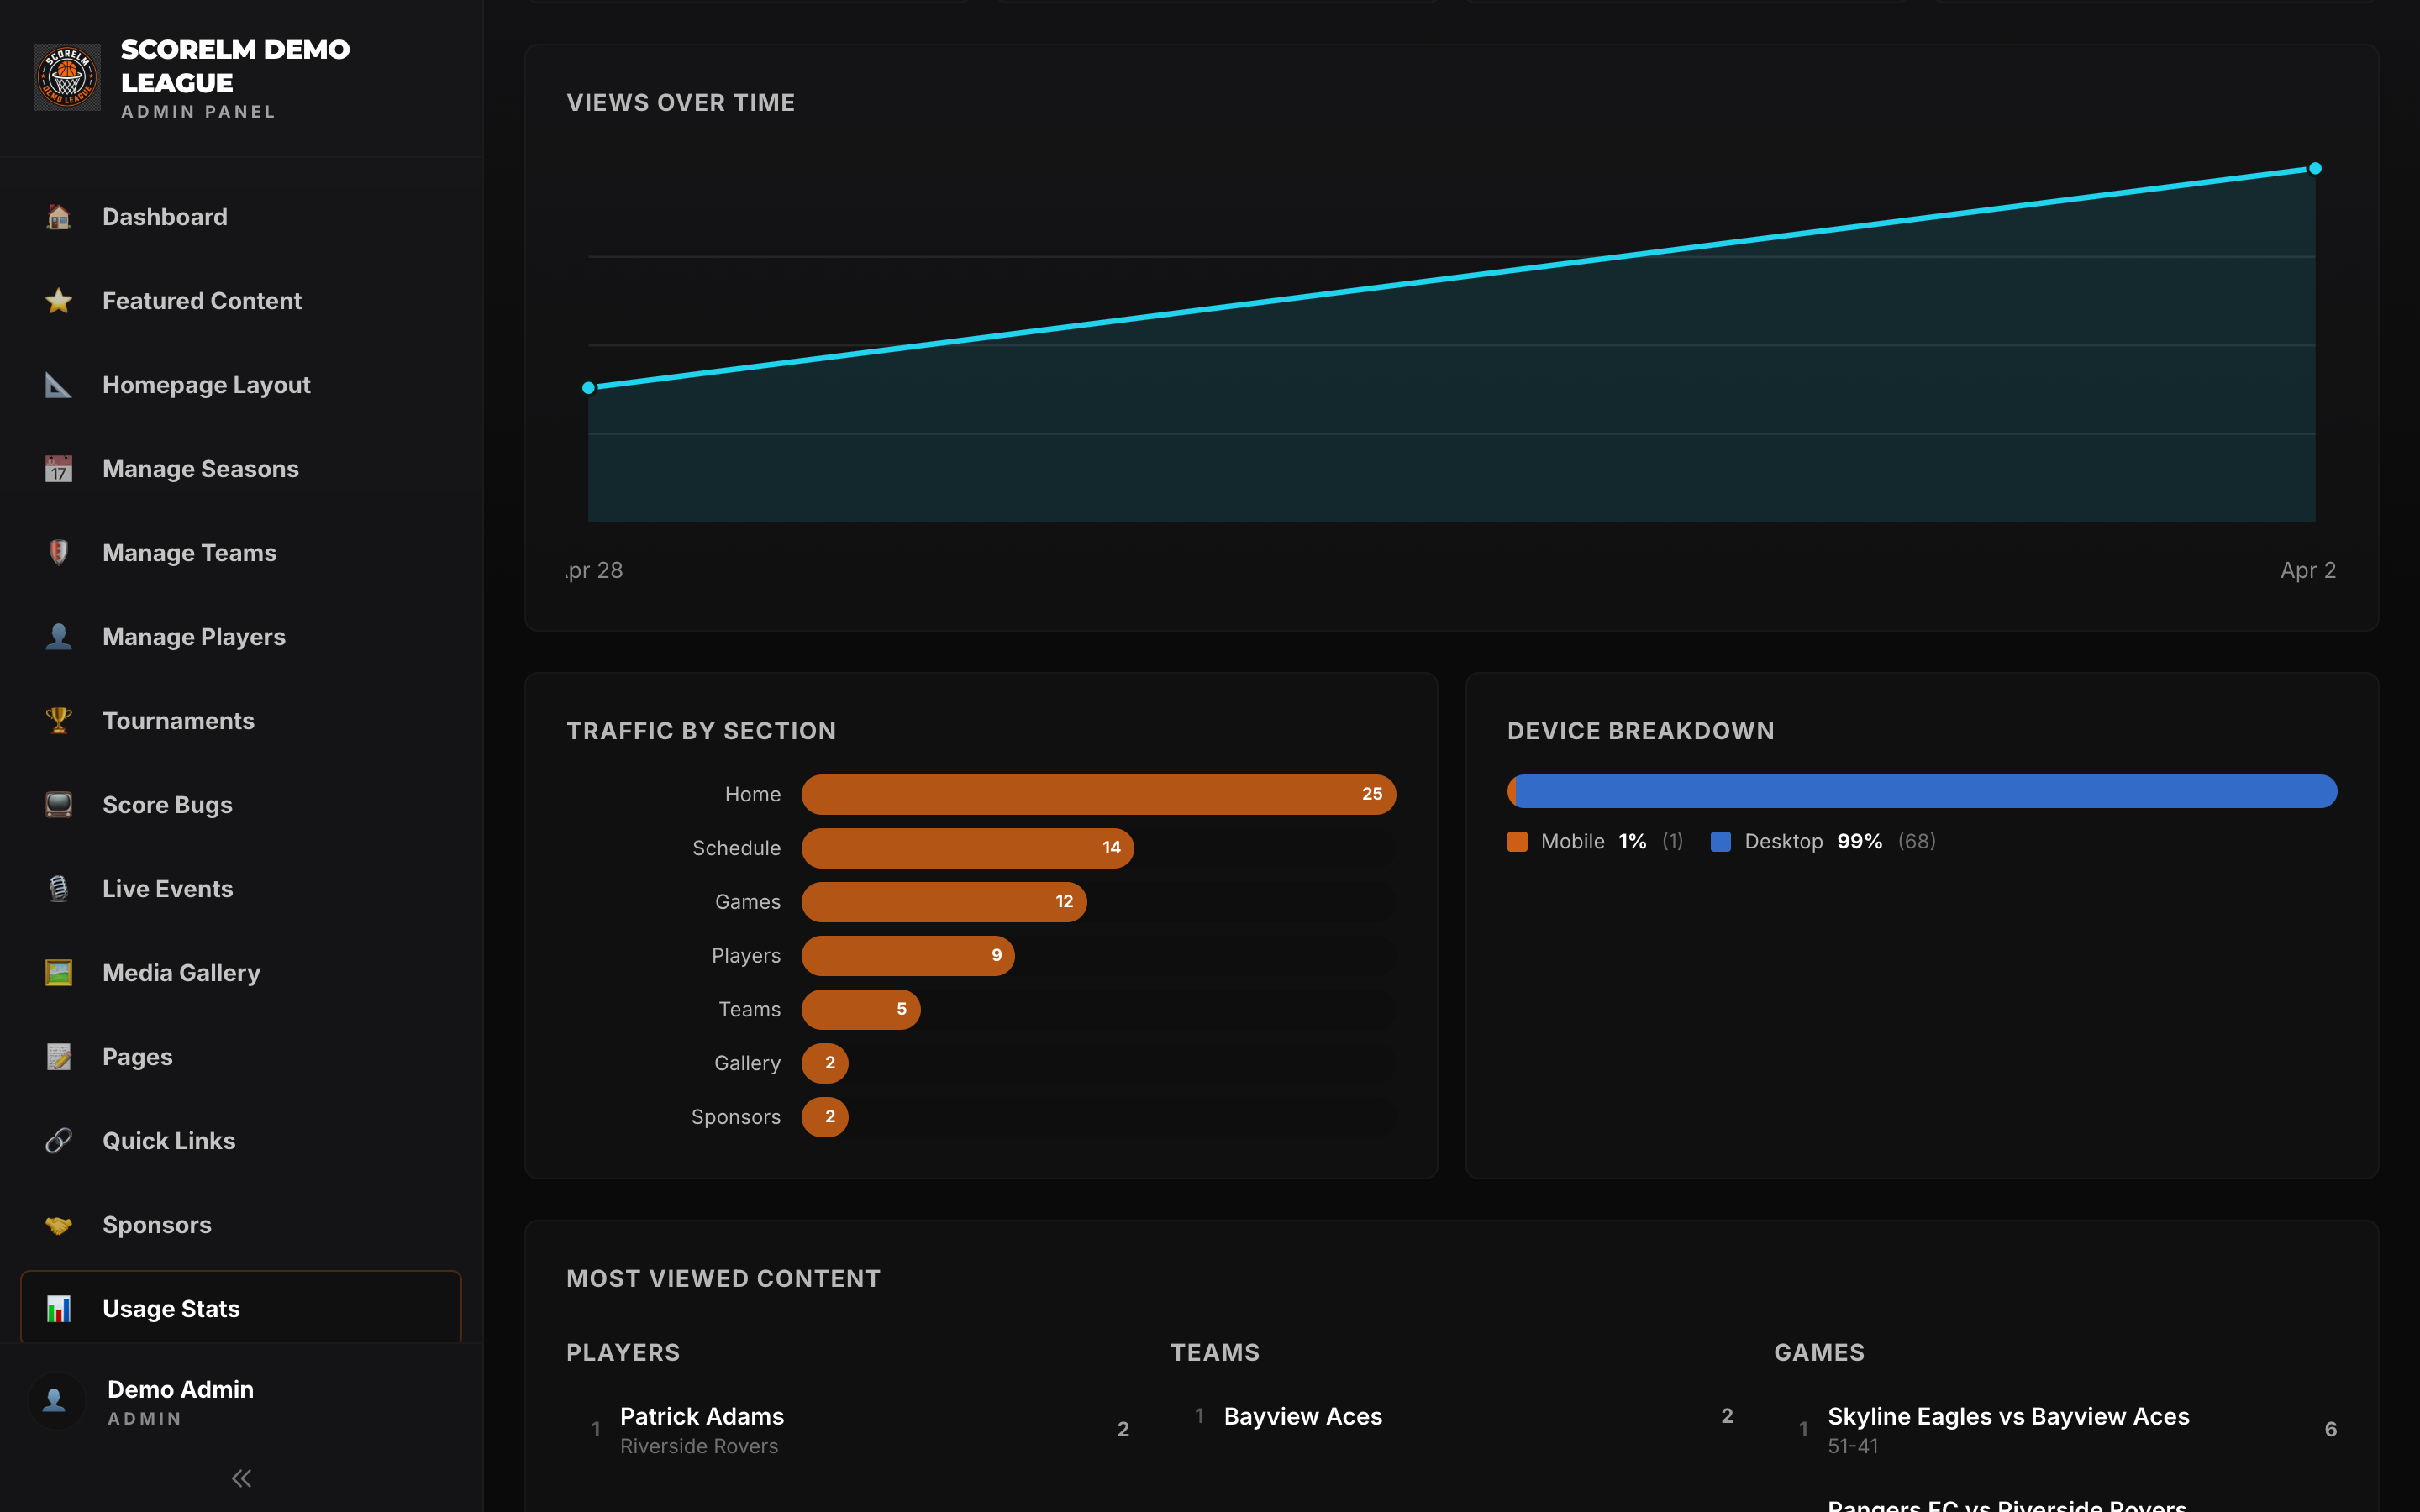
Traffic Sources
Where fans actually come from
WhatsApp is huge and most analytics tools pretend it doesn't exist. ScoreLM tracks it properly -- alongside Instagram, direct traffic, and Google. You finally know whether that group chat is doing real work.
- WhatsApp traffic broken out -- not lumped in with "direct"
- Instagram stories, bio links, and posts counted separately
- Direct, Google search, and referrals for everything else
- Per-game breakdown -- see which channel drove which spike
Stream Analytics
How many people actually watched
Stream data pulled directly from YouTube -- peak concurrent viewers per game, total watch time, average view duration. No need to dig through YouTube Studio and piece it together yourself.
- Peak concurrent viewers for every game, ranked
- Total watch time and average view duration
- Playback stats from the embedded YouTube player on your site
- Replay vs. live viewership split -- know when the real audience is watching
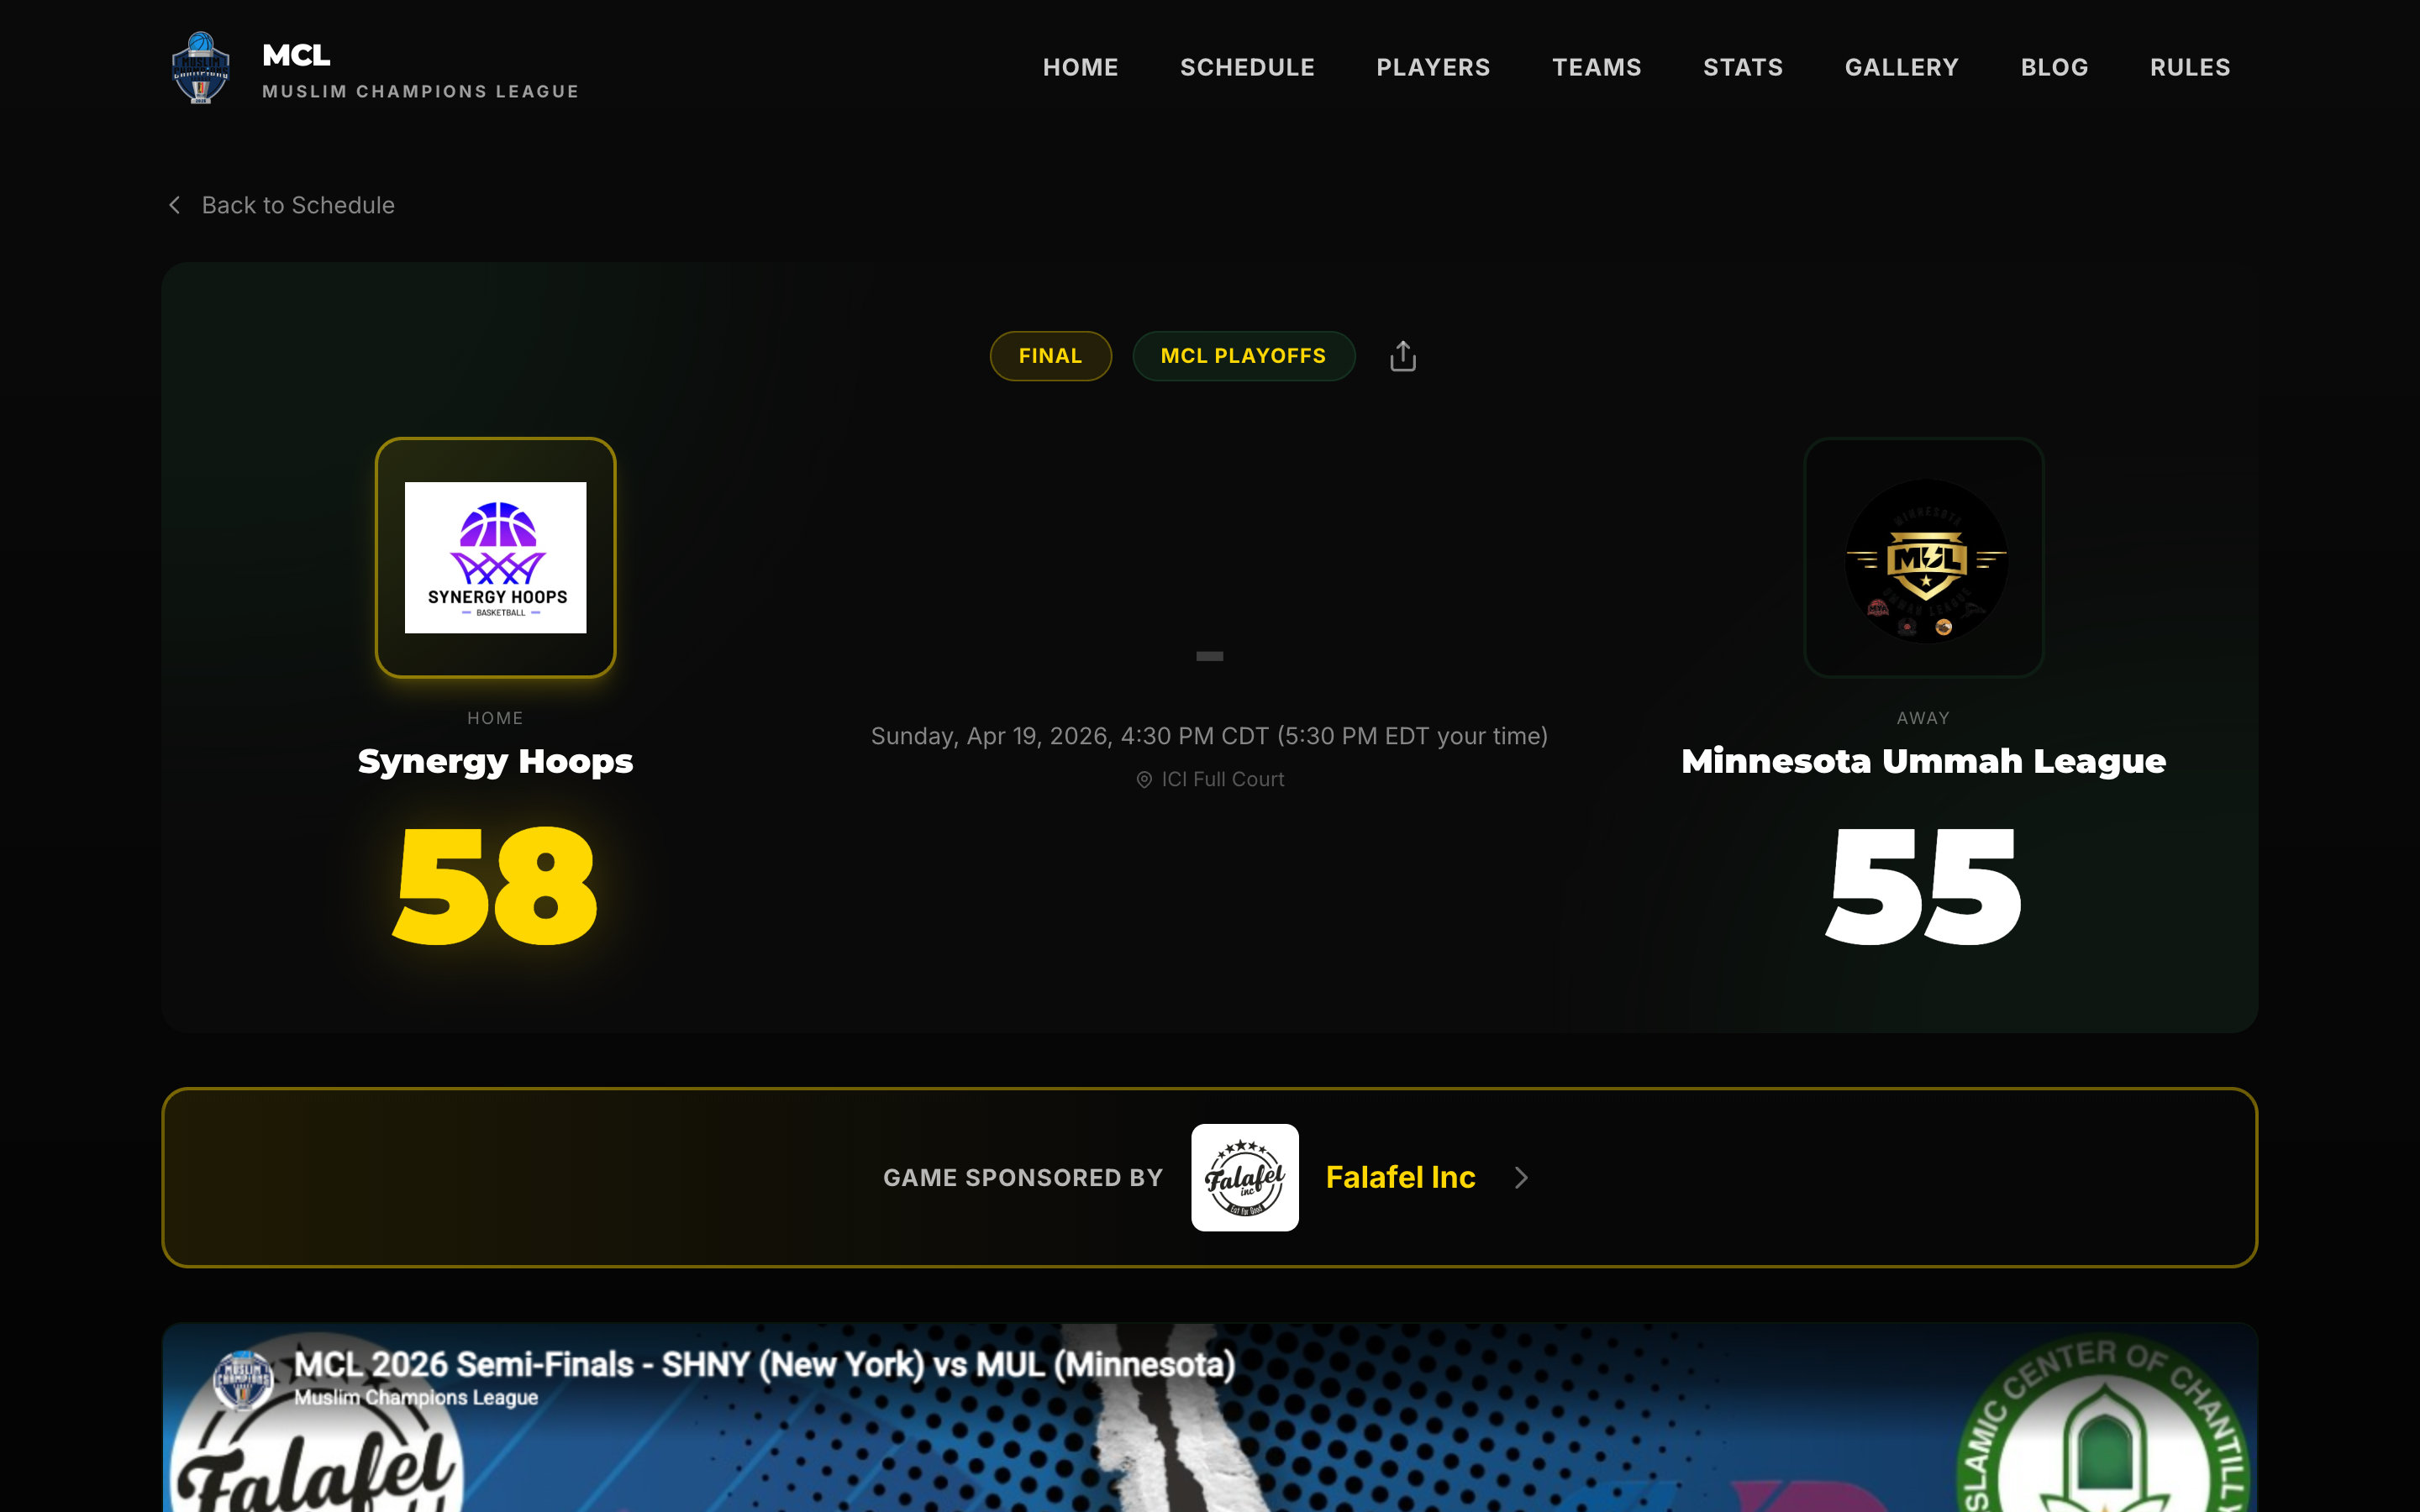
Sponsor Reporting
Answer the question sponsors always ask
"How many people saw my logo?" Every sponsor asks. ScoreLM tallies impressions per sponsor across the site, scorebugs, and stream overlays -- so when it's time to renew, you show up with a number instead of a shrug.
- Total impressions per sponsor, across every surface
- Broken down by site placements, scorebug pop-ups, and stream
- Exportable per-sponsor report for renewal conversations
- Season-over-season comparison -- show growth, justify the price
Plain English
Real numbers, not a Google Analytics dashboard
You shouldn't need a certification to know how your league is doing. Every metric is labeled in words you'd actually say out loud -- no "sessions per user" or "bounce rate" unless you really want it.
Dashboard to check -- not six tabs across three tools
Tracking scripts to install -- it's built in
Of metrics labeled so a non-technical board member gets it
Why This Matters
Sponsors ask. You need an answer.
Every sponsor conversation eventually comes down to the same question -- how many people saw the logo? Leagues that can answer with a real number keep their sponsors. Leagues that say "a lot" lose them at renewal.
Same goes for the board, the parents, the commissioner -- anybody you have to report to. "We had 8,400 page views last week, the Eagles-Hawks game peaked at 312 concurrent viewers, and most of the traffic came from the Saturday morning WhatsApp share" is a different conversation than "things went well."
Know what fans actually watch
Analytics are built in on every plan. No extra setup, no tracking scripts, no dashboards to learn.